Challenge A: Statistics in Everyday Life
Introduction:
I would like to choose to focus on some basic statistical concepts, such as mean, median and mode. I believe these are essential foundations for understanding data in daily lifes. Since my major is statistics, I want to find a way to make these ideas more concrete and approachable—not only for myself, but also for anyone who might feel intimidated by numbers. According to multimedia learning theory, people learn better when text and visuals are combined, so I hope this comic can make statistics more engaging and easier to grasp.
Theme:
The theme of my comic is “Statistics in Everyday Life.” I chose this topic because basic statistical ideas are not only important in academic learning but also appear in many daily activities. Statistics and datas appear in almost everything in our daily lives, especially in this era of big data. Whether it is comparing prices while shopping, understanding income distributions, or reading survey results, these concepts help us make sense of the world.
On the hand, statistics can often feel abstract or intimidating, especially for beginners. To make these ideas more approachable, I use comics to combine text and image in a way that is easier to digest, since the sum of visuals and words is often greater than the parts alone. By wrapping concepts like mean, median, and mode into small stories with relatable characters, I also apply storytelling techniques that make the learning more memorable. My aim is to show how statistics is both practical and approachable, and to help readers see that these concepts are not just numbers in a textbook but useful tools for everyday life.
Learning Objective:
This comic project aims to help readers understand and apply basic statistical concepts, such as mean, median, mode, and sampling, by showing them in everyday situations. Combining text with simple visuals, the project adheres to the principle of multimedia learning that learners process information more effectively when text and images are presented together.
Context & Audience:
The target audience includes students and general readers who may find statistics too abstract to understand. The appropriate age for readers is probably 10-15 years old. They are usually exposed to data and statistical concepts in their daily lives, such as news reports or school assignments. Therefore, they will grasp some basic concepts of statistics and data through these comics because these comics can make these statistical concepts easy to understand and apply.
In addition, the project uses storytelling to keep readers engaged. By embedding statistics in relatable everyday scenarios (like exam scores or food choices), the narrative adds an emotional dimension that sustains attention and helps learners connect the concepts to their own experiences. In this way, the comics make statistical concepts approachable, memorable, and directly applicable to everyday life.
Storyboard:
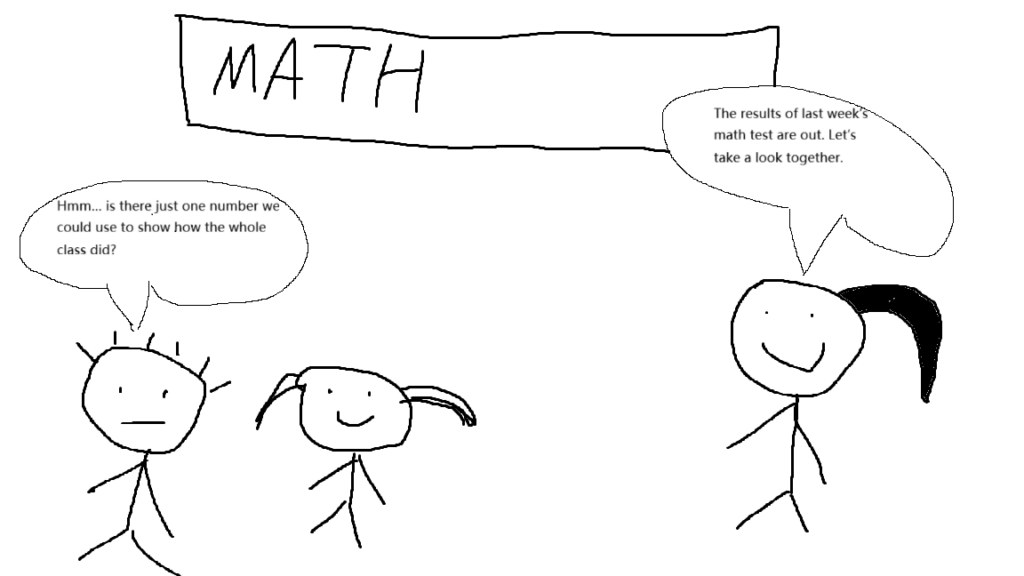
Panel 1: Opening Scene:
Scenario: A classroom with students and teacher
Teacher: “The results of last week’s math test are out. Let’s take a look together.”
Student A: “Hmm… is there just one number we could use to show how the whole class did?”
Panel 2: Mean
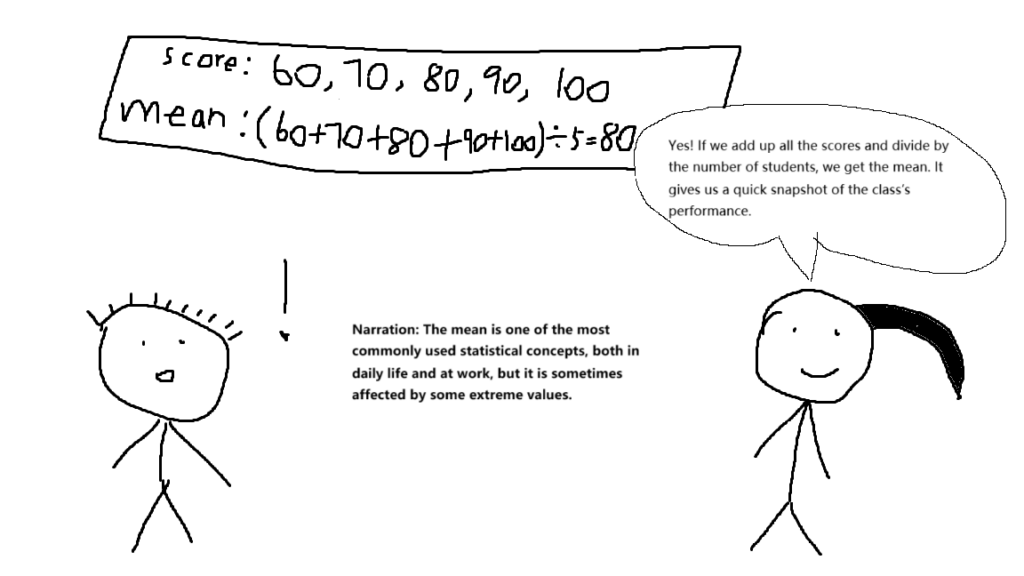
Teacher: “Yes! If we add up all the scores and divide by the number of students, we get the mean. It gives us a quick snapshot of the class’s performance.”
Narration: The mean is one of the most commonly used statistical concepts, both in daily life and at work, but it is sometimes affected by some extreme values.
Example: If the scores are 60, 70, 80, 90, and 100, then the mean value is (60+70+80+90+100) ÷ 5 = 80.
Panel 3: Outlier
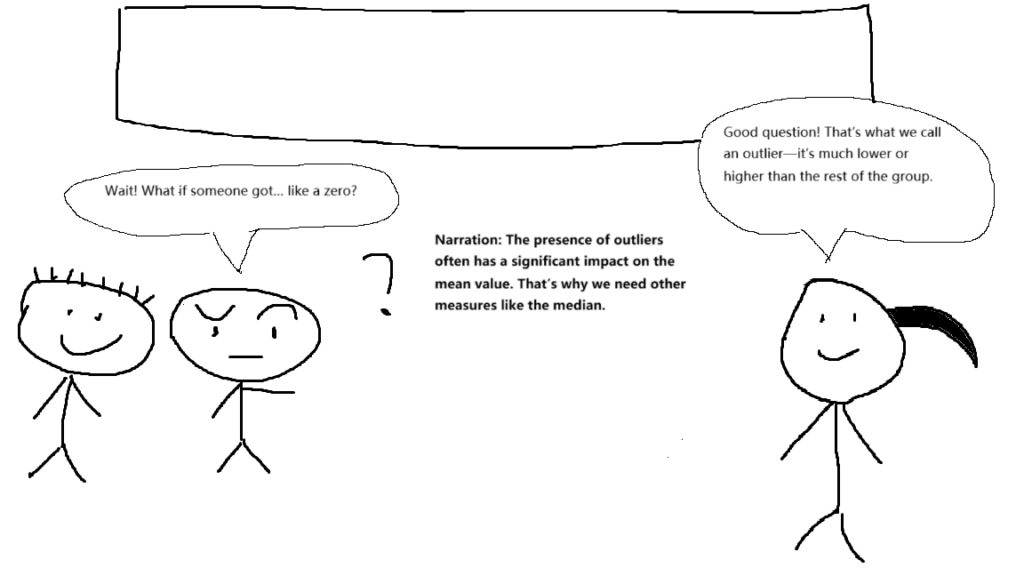
Student B: “Wait! What if someone got… like a zero?”
Teacher: “Good question. That’s what we call an outlier—it’s much lower or higher than the rest of the group.”
Narration: The presence of outliers often has a significant impact on the mean value. That’s why we need other measures like the median.
Panel 4: Median
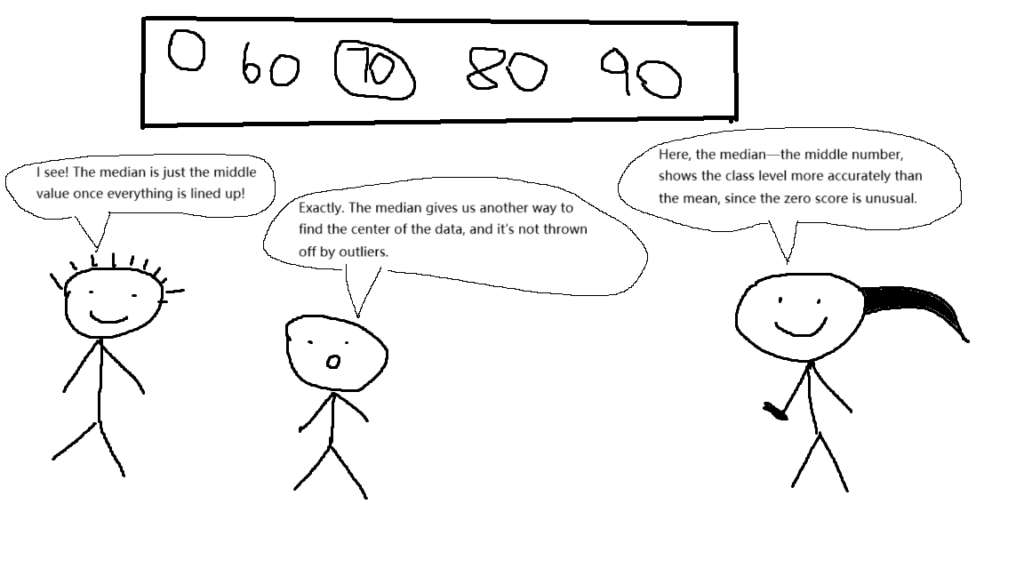
Scenario: The teacher writes the scores on the blackboard in order (0, 60, 70, 80, 90) and makes a circle of the 70.
Teacher: “Here, the median—the middle number, shows the class level more accurately than the mean, since the zero score is unusual.”
Student A: “I see! The median is just the middle value once everything is lined up!”
Student B: “Exactly. The median gives us another way to find the center of the data, and it’s not thrown off by outliers.“
Panel 5: Mode
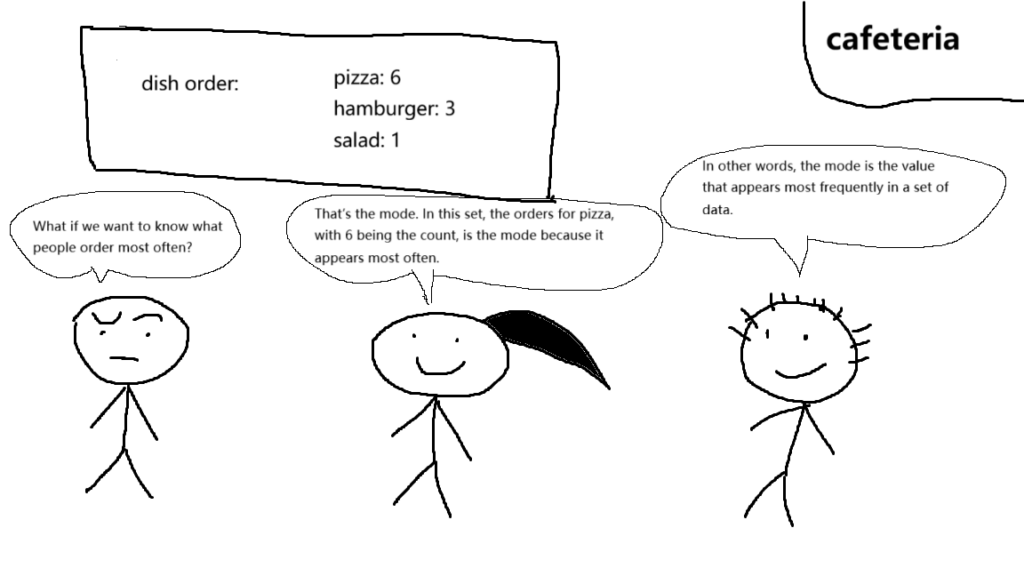
Scenario: At lunch time, the students order food in the cafeteria and write the statistics on the blackboard: 6 students order the pizza, 3 students order the hamburger, and 1 student order the salad.
Student B: “What if we want to know what people order most often?”
Teacher: “That’s the mode. In this set, the orders for pizza, with 6 being the count, is the mode because it appears most often.”
Student A: “In other words, the mode is the value that appears most frequently in a set of data.”
Panel 6: Range
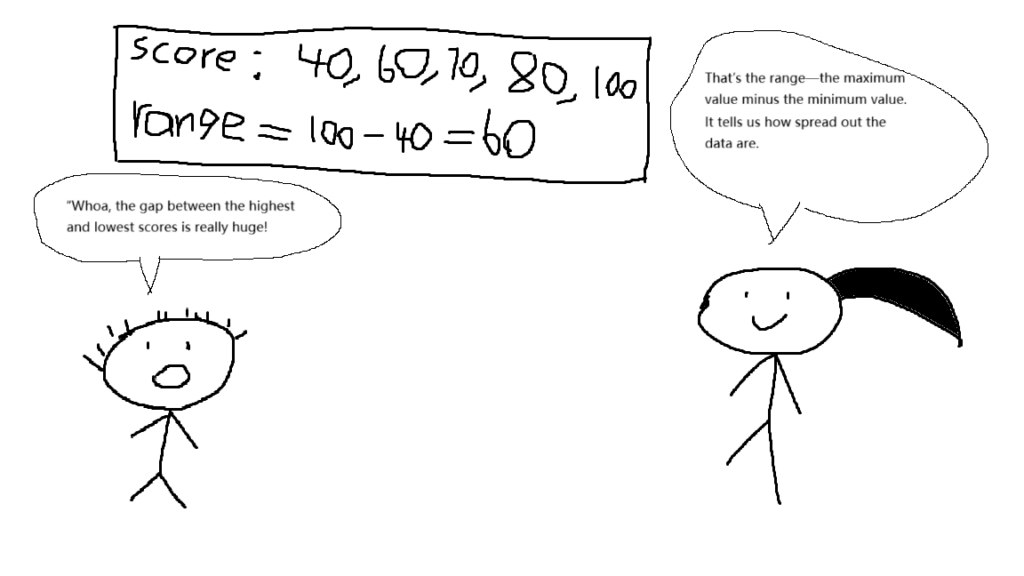
Scenario: The teacher wrote down the scores of several students on the blackboard: 40, 60, 70, 80, 100
Student A: “Whoa, the gap between the highest and lowest scores is really huge!”
Teacher: “That’s the range—the maximum value minus the minimum value. It tells us how spread out the data are.”
Panel 7: Correlation
Scenario: Class dicussion
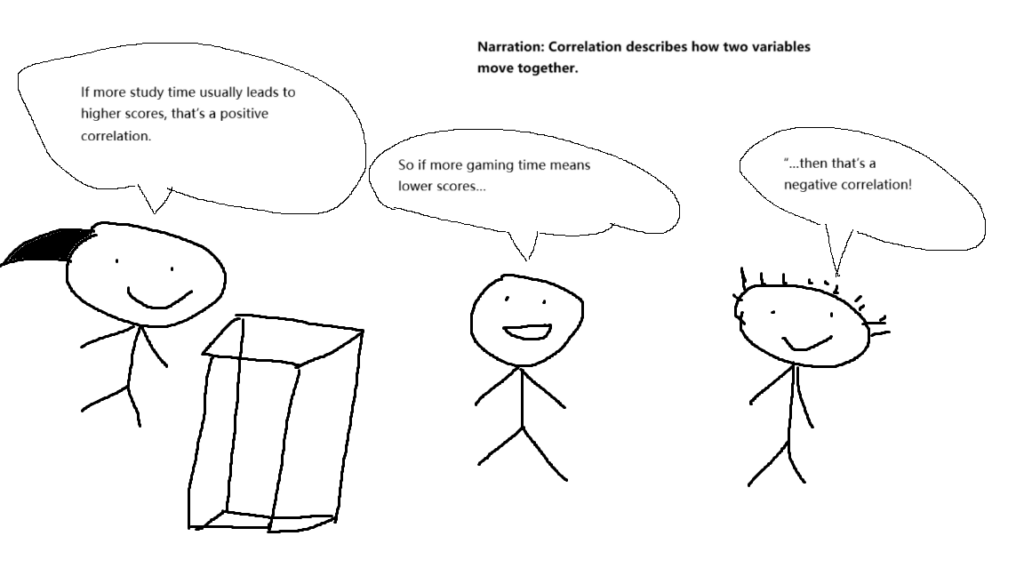
Teacher: “If more study time usually leads to higher scores, that’s a positive correlation.”
Student B: “So if more gaming time means lower scores…”
Student A: “…then that’s a negative correlation!”
Narration: “Exactly. Correlation shows how two things move together—up, down, or not at all.”
Panel 8: Variance/Standard Deviation
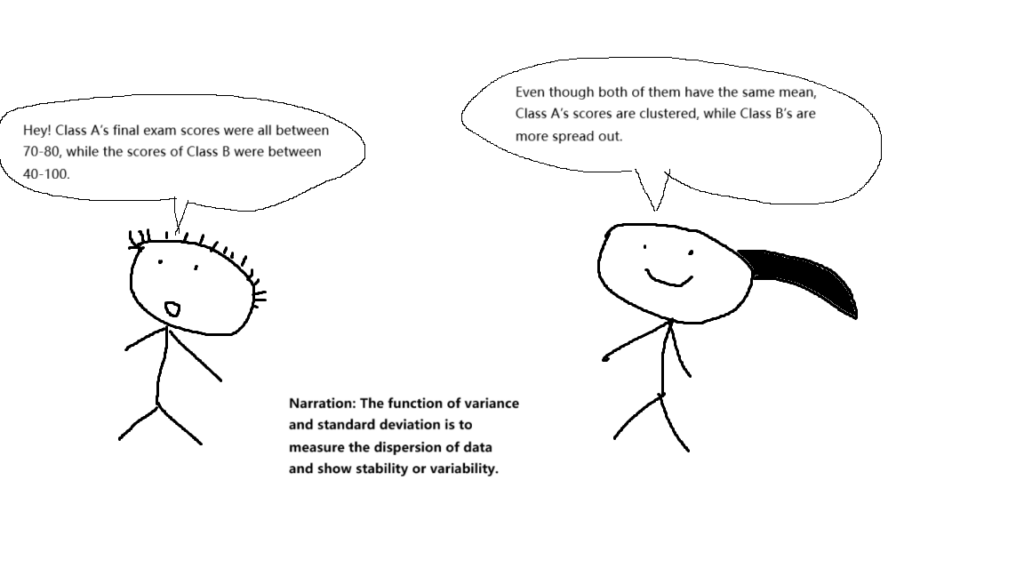
Student A: “Hey! Class A’s final exam scores were all between 70-80, while the scores of Class B were between 40-100.”
Teacher: “Even though both of them have the same mean, Class A’s scores are clustered, while Class B’s are more spread out.”
Narration: The function of variance and standard deviation is to measure the dispersion of data and show stability or variability.
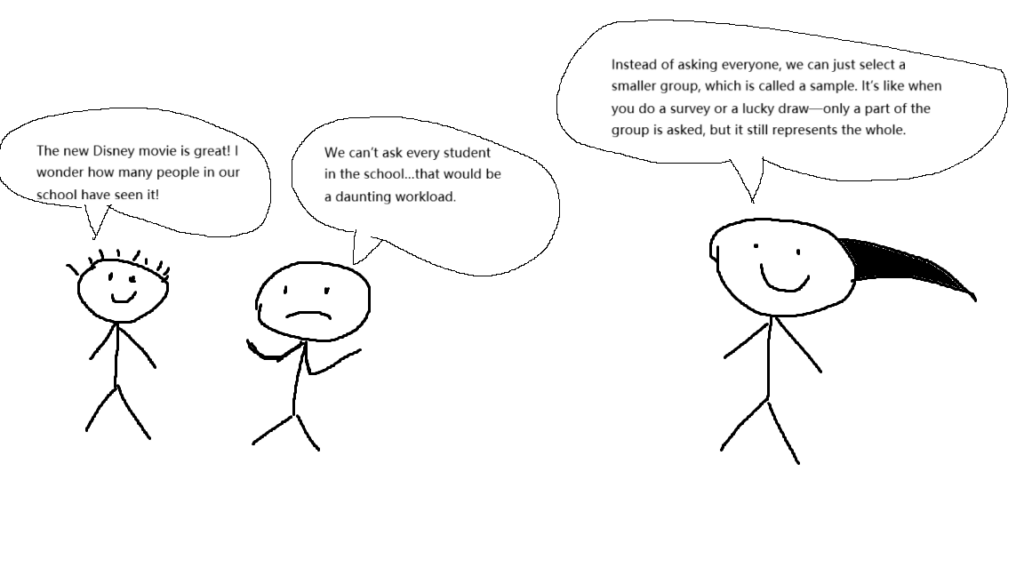
Panel 9: Sampling(1)
Student A: “The new Disney movie is great! I wonder how many people in our school have seen it!”
Student B: “We can’t ask every student in the school…that would be a daunting workload.”
Teacher: “Instead of asking everyone, we can just select a smaller group, which is called a sample. It’s like when you do a survey or a lucky draw—only a part of the group is asked, but it still represents the whole.”
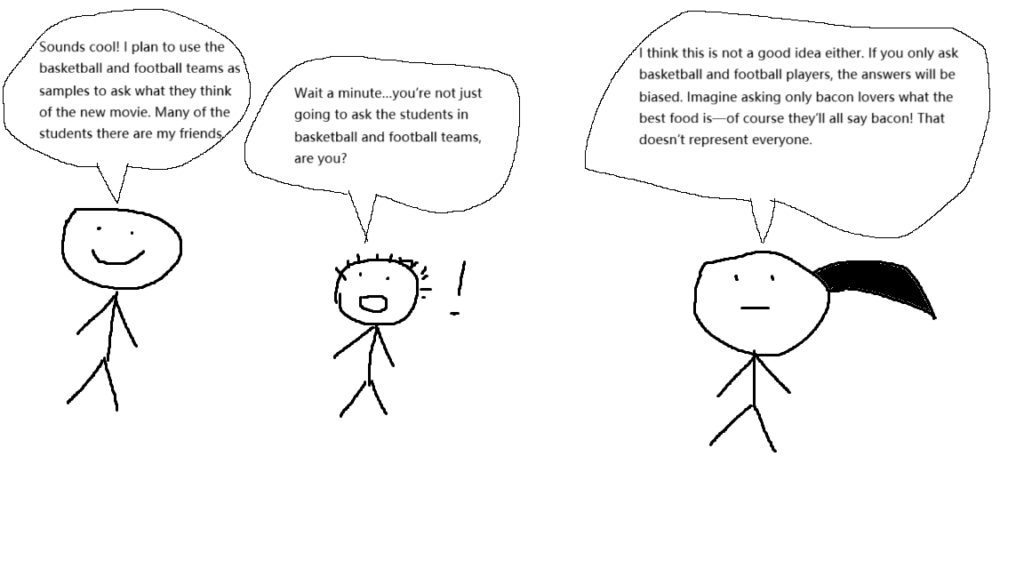
Panel 10: Sampling(2)
Student B: “Sounds cool! I plan to use the basketball and football teams as samples to ask what they think of the new movie. Many of the students there are my friends.”
Student A: “Wait a minute…you’re not just going to ask the students in basketball and football teams, are you?”
Teacher: “I think this is not a good idea either. If you only ask basketball and football players, the answers will be biased. Imagine asking only bacon lovers what the best food is—of course they’ll all say bacon! That doesn’t represent everyone.”
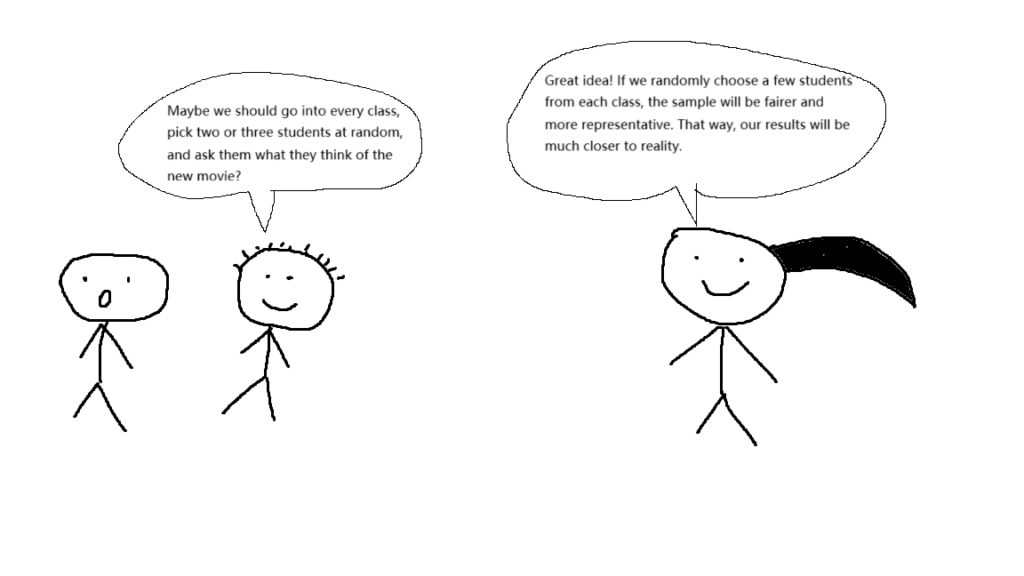
Panel 11: Sampling(3)
Student A: “Maybe we should go into every class, pick two or three students at random, and ask them what they think of the new movie?”
Teacher: “Great idea! If we randomly choose a few students from each class, the sample will be fairer and more representative. That way, our results will be much closer to reality.”
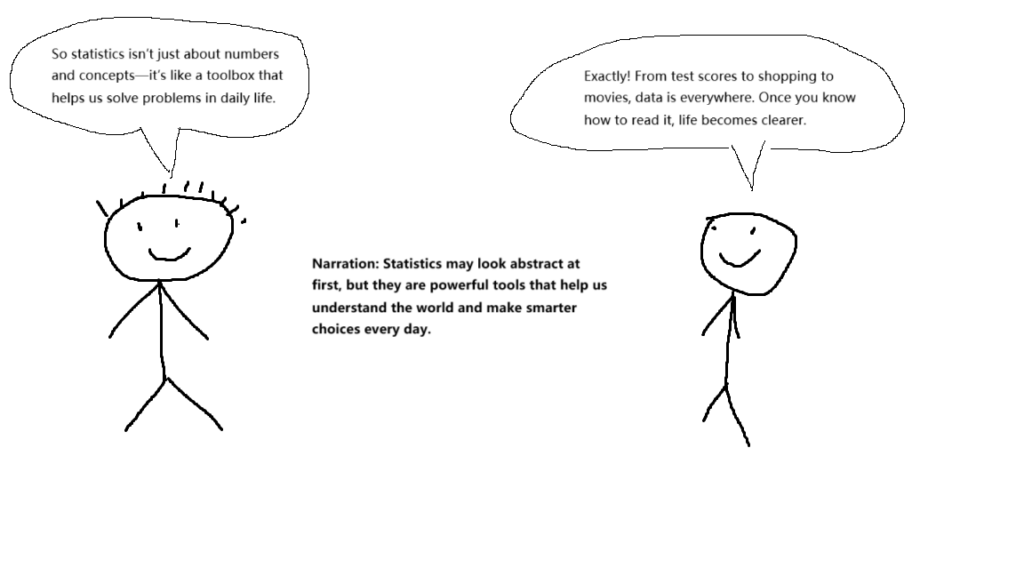
Panel 12: Conclusion
Scenario: After school, students left the classroom and chatting.
Student A: “So statistics isn’t just about numbers and concepts—it’s like a toolbox that helps us solve problems in daily life.”
Student B: “Exactly! From test scores to shopping to movies, data is everywhere. Once you know how to read it, life becomes clearer.”
Narration: Statistics may look abstract at first, but they are powerful tools that help us understand the world and make smarter choices every day.
Peer Feedback Summary
Roman appreciated that my topic is ambitious and relevant, since basic math and statistics are critical skills. He especially liked how I used segmentation in my comic, with each panel being self-contained and easy to follow. At the same time, he suggested that I narrow the focus depending on the target audience. For younger readers, for example, I could concentrate on just one skill such as mean, median, or mode instead of trying to cover many at once.
Hanna thought my idea was very creative and engaging, and she liked how I showed the value of studying without making it overwhelming. She noted that my comic could strongly connect with students aged ten to sixteen, since this is the age when habits are formed. She also liked that I included my own perspective as a student, which makes the challenge more relatable. Hanna encouraged me to make the comic even more fun and appealing—for example, by exaggerating scenarios (“what happens if you don’t study vs. what happens if you do”) or adding humor.
Reflection and Refine:
Things worked well:
Both Roman and Hanna noted that my comic is clearly structured, with each panel focusing on a statistical concept. They felt this step-by-step approach made it easier to follow and less intimidating for readers. Hanna also mentioned that incorporating my own student perspective made the topic more accessible. This suggests that my design adheres to Mayer’s principle of segmentation, as readers can learn concepts in small, digestible chunks.
Areas to improve:
Roman suggested that covering too many concepts at once could overwhelm young readers, while Hanna encouraged me to incorporate humor or exaggeration to make the story more engaging. Their feedback helped me realize I needed to strike a balance: not only explaining definitions but also ensuring readers of all ages could enjoy the story. This resonates with storytelling theory, which suggests that emotional engagement makes learning more memorable.
Changes I applied:
Based on this feedback, I simplified some of the wording to make the explanations easier for beginners to understand. To make the comic feel less like a lecture but a daily interactions, I inserted more natural student questions and brief conversations. At the same time, I chose not to add too many extra characters because I wanted to avoid distracting from the main idea—this is in line with the principle of consistency.
What I learned from the process:
This project taught me how comics can make abstract topics more accessible by combining visuals with brief dialogue. My comic’s strength is that it connects statistics to everyday situations, such as the sales of different items in a supermarket, allowing readers to understand the significance of these concepts. A downside is that I still tried to incorporate many concepts, which might be a bit overwhelming for some readers. In the future, I might narrow the scope. For instance, focusing on just the mean or sampling, so that I can delve deeper into the examples without overloading the reader.
Strengths and limitations:
A major strength of this comic project is that it demonstrates how abstract concepts can be made concrete through visuals paired with brief dialogue. This embodies Mayer’s dual-channel principle, which states that learners learn more effectively when they process information through both verbal and visual modalities. Furthermore, the segmentation principle is clearly applied, as each section presents a concept in a self-contained manner, making the content more concise and easier to understand.
However, a limitation of comics is that they can sometimes oversimplify complex statistical concepts, ignoring the nuances that students may encounter in real-world data analysis. This ties in with Sweller’s cognitive load theory: while breaking content down into small steps can reduce irrelevant load, oversimplification can also reduce relevant load and limit deeper learning. Overall, the comic format is approachable and engaging, but a careful balance needs to be struck between accessibility and depth.
Reference:
Granchelli, A. (2025, September 5). Theories of multimedia learning. EDCI 337. https://edtechuvic.ca/edci337/2025/09/05/theories-of-multimedia-learning/
Granchelli, A. (2025, September 11). Text and image: The sum is greater than its parts. EDCI 337. https://edtechuvic.ca/edci337/2025/09/11/text-and-image-the-sum-is-greater-than-its-parts/
Granchelli, A. (2025, September 14). Storytelling. EDCI 337. https://edtechuvic.ca/edci337/2025/09/14/storytelling/